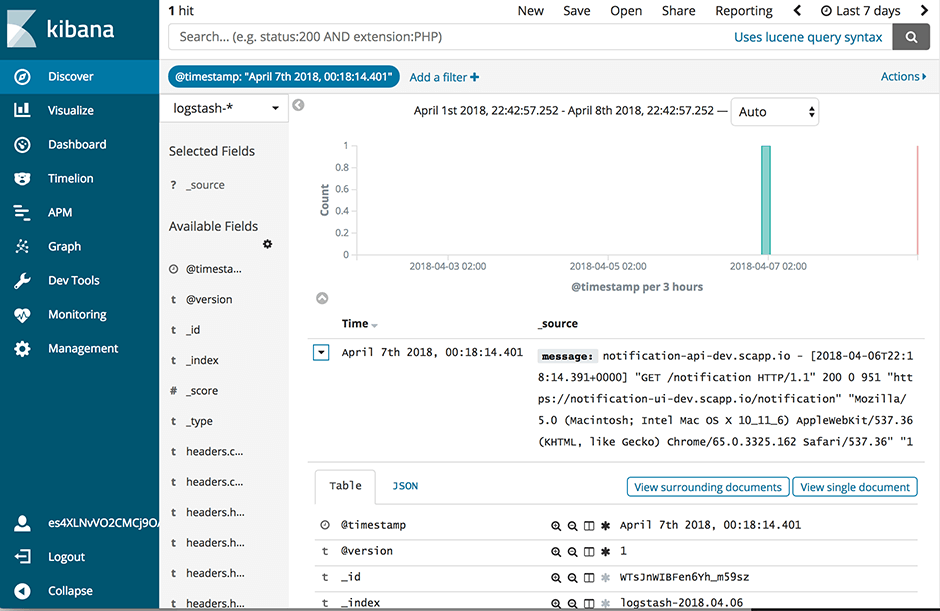
Der alte ELK-Dienst verfügte über einen Filter, der die Log-Meldungen analysierte und
- Felder gemäß der Syslog-Protokollspezifikation(öffnet ein neues Fenster) extrahierte- Nachrichten, die JSON-Objekte enthalten, entsprechend den JSON
- Attributnamen in Felder aufteilte
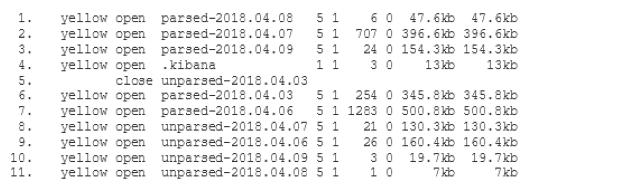
Außerdem gab es eine Curator(öffnet ein neues Fenster)-Konfiguration, die dafür sorgte, dass Elasticsearch in regelmäßigen Abständen aufgeräumt wurde. Wir werden die Einzelheiten der Konfiguration von Curator in einem zukünftigen Beitrag beschreiben.
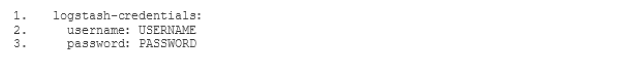
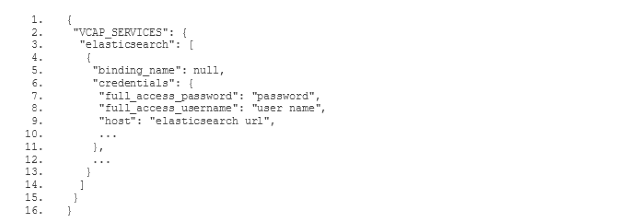
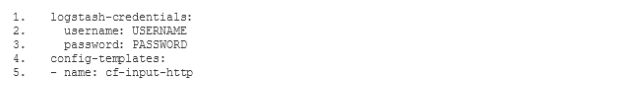
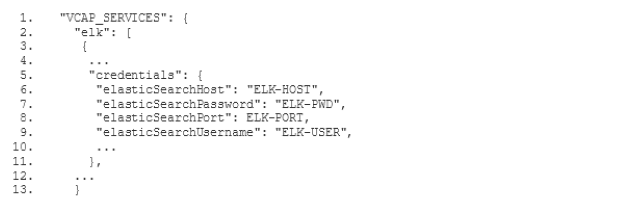
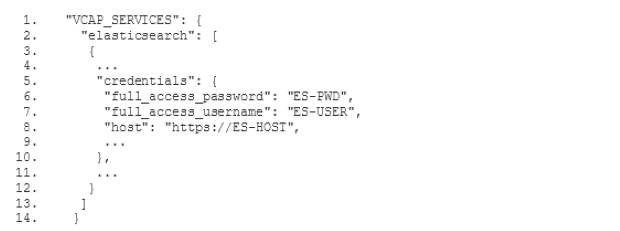
Bevor wir mit der Filterkonfiguration beginnen, solltest du wissen, dass du die Vorlagen für die unten aufgeführten Konfigurationsdateien(öffnet ein neues Fenster) auf Github findest. Es handelt sich um Vorlagen, weil du bestimmte Parameter, wie den Elasticsearch-Hostnamen deiner Instanz und die Zugangsdaten, durch die entsprechenden Werte aus deiner Umgebung ersetzen musst.
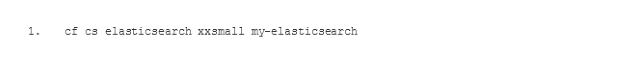
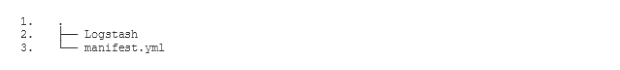
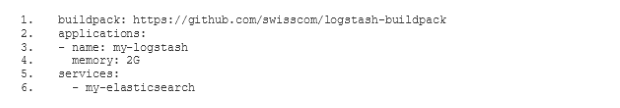
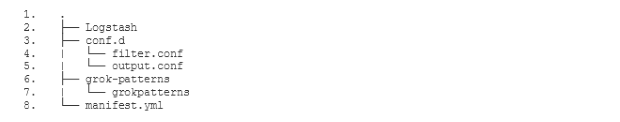
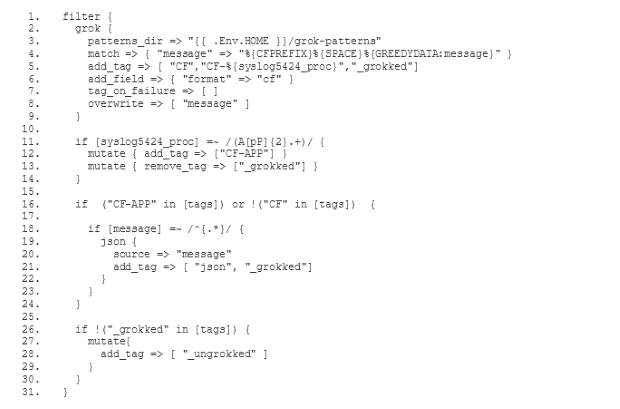
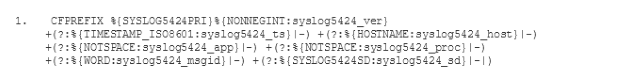
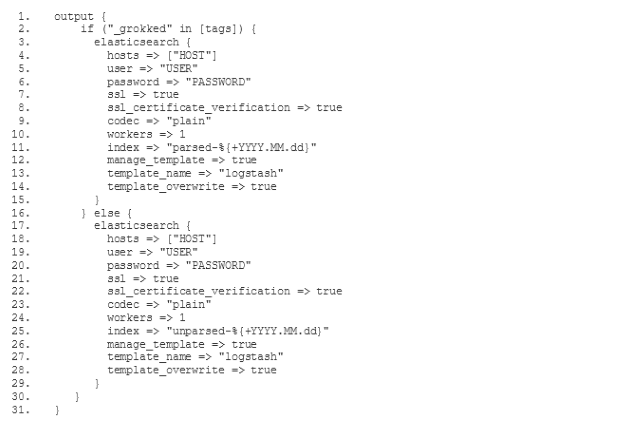
Um unseren neuen ELK-Stack so zu konfigurieren, dass er die Logs auf die gleiche Weise verarbeitet wie der alte ELK, müssen wir den gemischten Konfigurationsmodus wählen, der in der Dokumentation des Logstash-Buildpacks(öffnet ein neues Fenster) beschrieben wird. Vor allem müssen wir unsere eigene Filter- und Ausgabekonfiguration festlegen. Zu diesem Zweck fügen wir zwei neue Unterverzeichnisse conf.d und grok-patterns zu dem Verzeichnis hinzu, in dem wir unsere Logstash-Konfiguration eingerichtet haben. Außerdem fügen wir die Dateien filter.conf, output.conf und grok-patterns wie folgt in diese Verzeichnisse ein: