Cloud
Erhalte deine gecachten App-Logs und Metriken mit hoher Leistung!
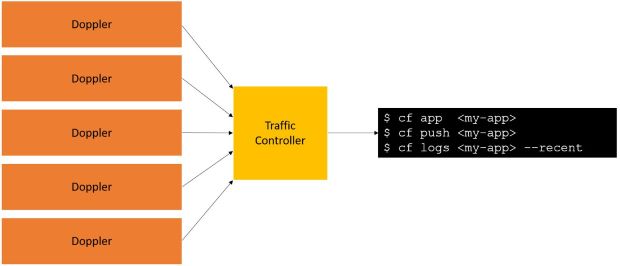
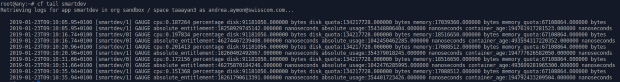
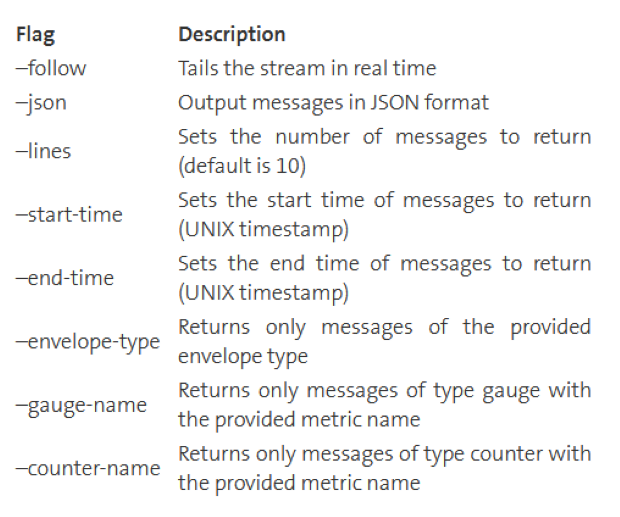
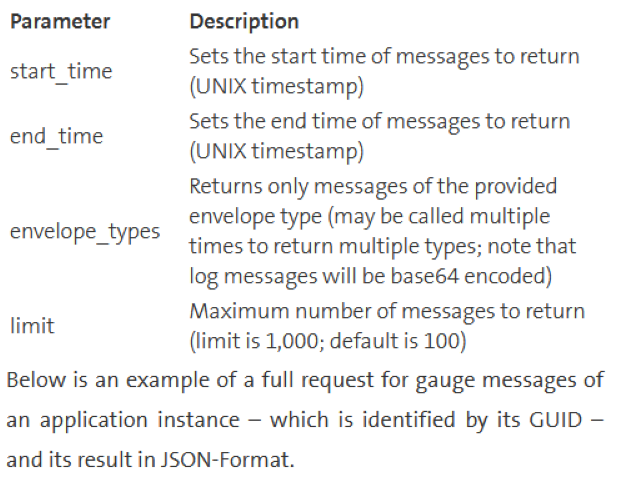
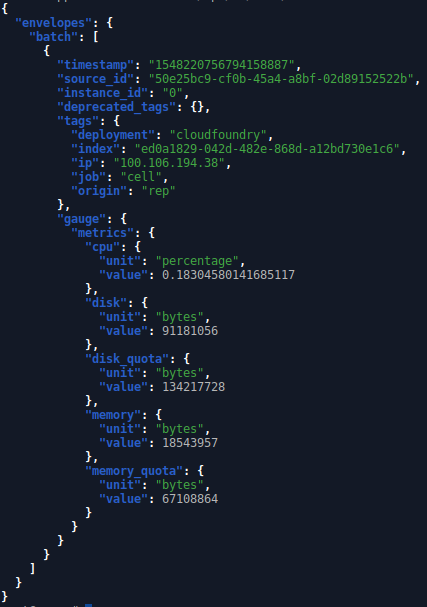
Log Cache ist eine Loggregator-Funktion, mit der du App-Protokolle und Metriken über ein CLI-Plugin oder API-Endpunkte filtern und abfragen kannst - mit einer besseren Leistung als bisher. Außerdem sind zwischengespeicherte App-Protokolle und Metriken bei Bedarf verfügbar; du musst sie nicht ständig streamen. Um dies zu verstehen, werfen wir einen Blick auf die Geschichte des Log-Streamings in Cloud Foundry.