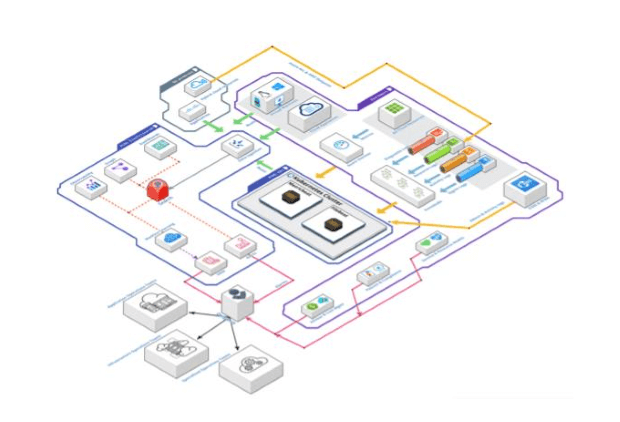
Right out of the bat, I want to say that the landscape of our customer’s infrastructure and applications is continuously evolving. As the number and the diversity customers is growing, so is the product market fit. Our challenges include onboarding new customers which almost always translates to figuring out how we will monitor new cloud services and applications, at-times in cloud native and at-times in hybrid environment.
A picture speaks a thousand words, the diagram above details the observability and monitoring landscape at PCMS for Azure (we also have AWS customers but that’s another blog post for another day soon).
We have the first layer, telemetry, in the top right-hand-side . This includes data sources of our public cloud customers, like different types of logs of the PaaS and SaaS cloud resources, e.g. activity logs or sign-in logs gathered using EventHub and their metrics gathered from Azure Monitor. In addition, we have the IaaS resources sending their metric and logs using Beats agents directly to our Elastic stack, and also grab the administrative and activity logs of O365 and M365 cloud services to provide observability & monitoring solutions for deliver cloud workplace domain. Last but not the least is the upcoming trend of hybrid scenarios, where our customers are connecting their multiple clouds and on-premises infrastructure, we gather logs and metrics of certain resources, at time directly and sometimes via public clouds route; this is when customers are using public cloud services like Azure Arc and AWS outpost.
The second layer is data storage. Before we go into that though, it is important to understand data ingestion. We have two data ingestion endpoints. They can be simply broken down into push and pull modes. We have our Metricbeat and Filebeat agents running on Kubernetes infrastructure pulling metrics, logs, and traces from public clouds. This concerns primarily PaaS and SaaS resources, the exception being the activity logs which are valid for all types of resources. The second ingestion endpoint is our Elastic ingest nodes, which resides directly in our Elastic stack. The agents running on IaaS or sometimes compute-based cloud appliances send their metrics, logs, and traces directly to our Elastic stack. Once the data is ingested, it is stored in Lucene indices in the backend. The retention of data depends on the data type and the business use case. It remains nonetheless configurable per dataset, for customers with specific retention requirements.
As a repetition of the final word from the first part of the blog series, Monitoring and Observability go hand in hand, one does not replace another but together enable and enhance defined business outcomes.
This is the part two of a two part blog, the first part which explains how monitoring and observability go hand in hand, is available here.
Chetan Goswami
DevOps Engineer
Trova il posto di lavoro o il percorso di carriera che fa per te. Dove dare il tuo contributo e crescere professionalmente.
Ciò che tu fai, è ciò che siamo.