Data Analytics
Get your app metrics from the Application Cloud
Where are my metrics? A Cloud Foundry story
Data Analytics
Where are my metrics? A Cloud Foundry story
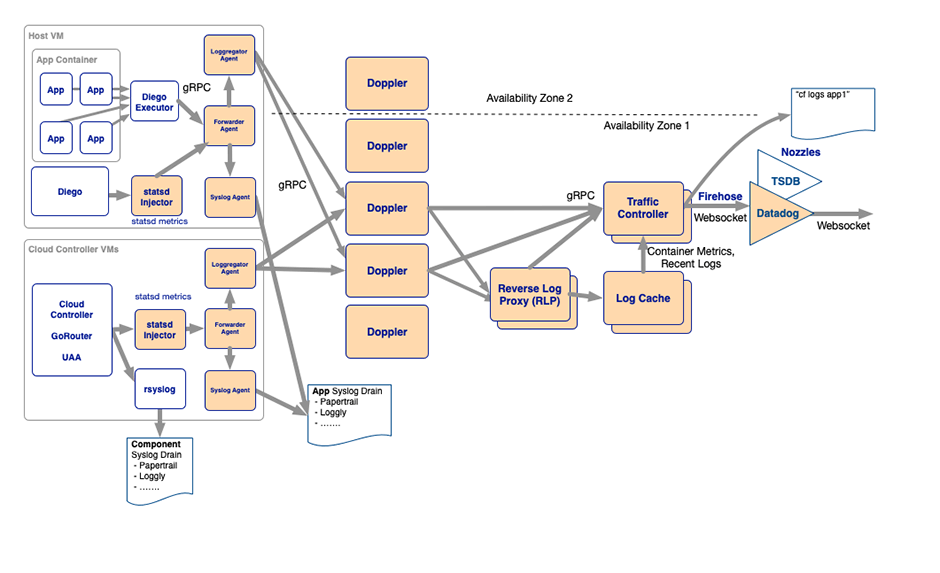
The Loggregator in Cloud Foundry is the system behind the scenes that’s responsible for gathering and streaming logs and metrics about user apps. It also gathers and streams metrics from Cloud Foundry components itself and health metrics from other platform VMs. Loggregator allows you to view these logs and metrics either through the Loggregator CF-CLI-Plugins(opens in new tab) or through various third-party services and consumers, like for example the Cloud-Controller (API), a Firehose Nozzle or a Log-Cache endpoint.
The Loggregator uses a microservices design architecture architecture that includes components for collecting, storing, and forwarding logs and metrics:
Further information about the Loggregator system overall:
https://docs.developer.swisscom.com/loggregator/architecture.html(opens in new tab)
https://docs.developer.swisscom.com/loggregator/container-metrics.html(opens in new tab)
Out of all the components the Loggregator system is made up from the most interesting for our use case is the Log-Cache.
Log-Cache is an in-memory store that allows you to view logs and metrics from Loggregator over a specified period of time. Log-Cache includes API endpoints and also a CF-CLI-Plugin(opens in new tab) to query and filter logs and metrics. The Log-Cache API endpoints are available by default. For more information about using the Log-Cache API directly you can check out Log-Cache(opens in new tab) on GitHub.
The Reverse Log Proxy (RLP) in Cloud Foundry is there to collect logs and metrics from the Dopplers and forward them to Log-Cache. It also has a RLP Gateway which allows external clients (i.e. you or your app) to connect to it and stream ingest envelopes (logs and metrics) from the Loggregator API.This API endpoint is commonly available at “log-stream.“.For example for the Swisscom AppCloud this would be at “https://log-stream.lyra-836.appcloud.swisscom.com” (and “https://log-stream.scapp-console.swisscom.com” for the internal AppCloud)
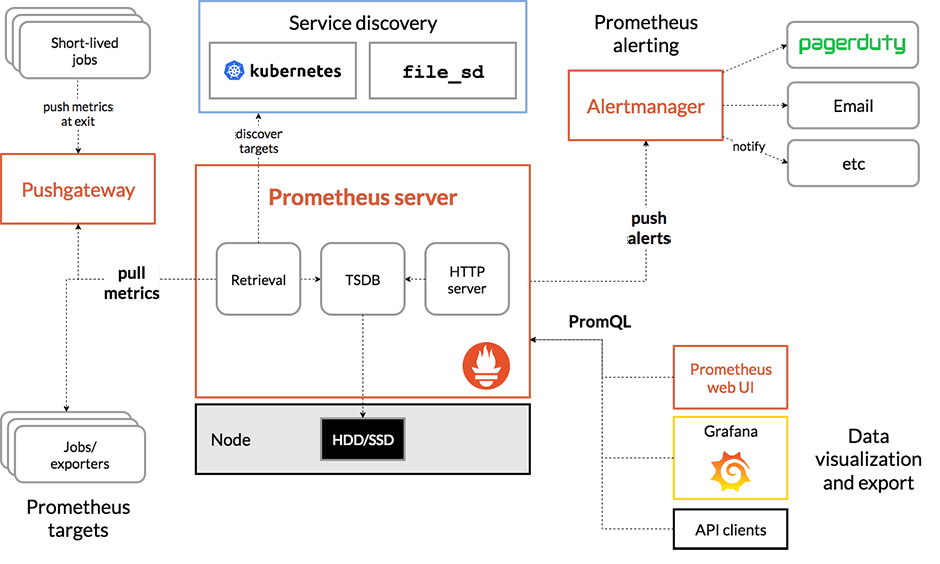
Prometheus(opens in new tab) is a system used for event monitoring and alerting. It records real-time metrics in its own time-series database with flexible queries and real-time alerting.
It works based on a PULL model, scraping metrics from available remote “/metrics” endpoints. It is very commonly used as the main monitoring system for cloud native applications.
Architecture overview:
Prometheus and Log-Cache are great, but how do I get these now to work together?
Since Prometheus is based on a PULL model you are going to need to somehow provide a “/metrics” endpoint for Prometheus that can be scraped. This is where the “paas-prometheus-exporter(opens in new tab)" comes into play.
It’s a simple app that you can push onto Cloud Foundry, then connects to the API to auto-detect all your apps, collects their metrics from Loggregator / Log-Cache for you and provides them at a Prometheus-compatible “/metrics” endpoint.If you’re a Golang developer it is actually be very easy to write your own app to do this thanks to the provided go-loggregator-Bibliothek(opens in new tab), which you can use to ingest the stream of logs and metrics from Cloud Foundry (see Beispiele(opens in new tab)) via the Reverse Log Proxy.
But for now let’s use the paas-prometheus-exporter to get our metrics. First you’ll have to create a new technical user to be used via the AppCloud Portal UI. You can then assign the roles OrgAuditor and SpaceAuditor to this new user for any orgs and/or spaces you want it to collect app metrics from.
Once pushed the exporter app will automatically detect any other apps from these orgs/spaces and collect their metrics information from Log-Cache in order to present it to you via its own /metrics endpoint.You can then configure your Prometheus to scrape metrics from there. An example manifest.yml and instructions on how to push/configure the app can be found in the Readme.
The following metrics will be exported for every application instance:
| Name | Type | Description |
| cpu | gauge | CPU utilisation in percent (0-100) |
| disk_bytes | gauge | Disk usage in bytes |
| disk_utilization | gauge | Disk utilisation in percent (0-100) |
| memory_bytes | gauge | Memory usage in bytes |
| memory_utilization | gauge | Memory utilisation in percent (0-100) |
| crash | counter | Increased by one if the application crashed for any reason |
| requests | counter | Number of requests processed broken down by status_range label |
| response_time | histogram | Timing of processed requests broken down by status_range label |
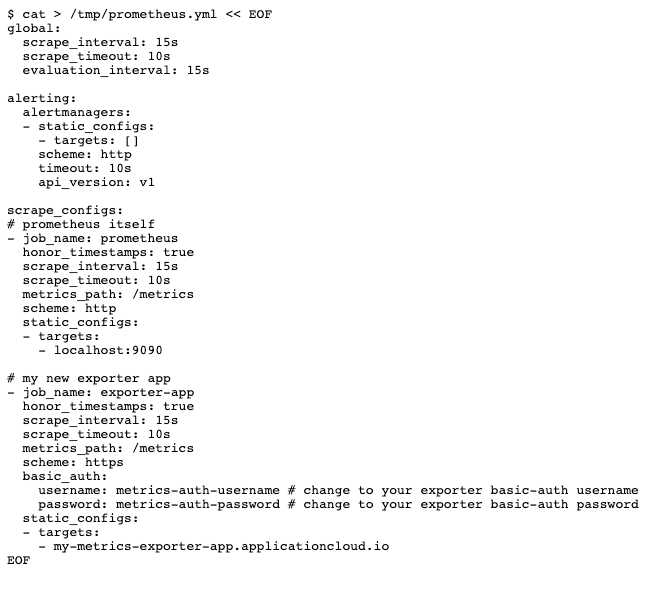
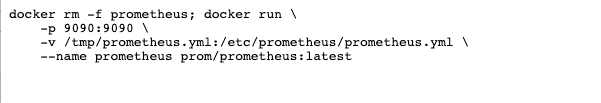
Let’s deploy a test setup with Prometheus and Grafana now on the appCloud to see how this can be used. First we’ll prepare a configuration file for Prometheus:
And then run it locally inside a Docker container:
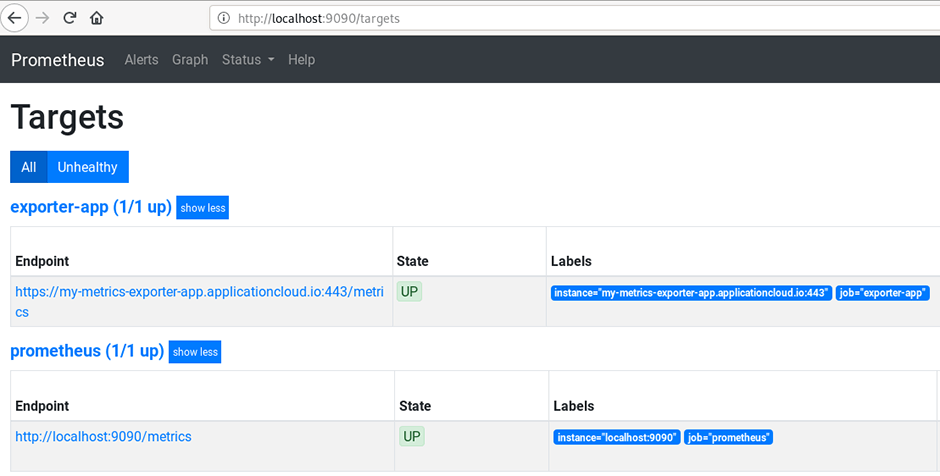
We can now access the Prometheus UI and check that our scrape target is working correctly:
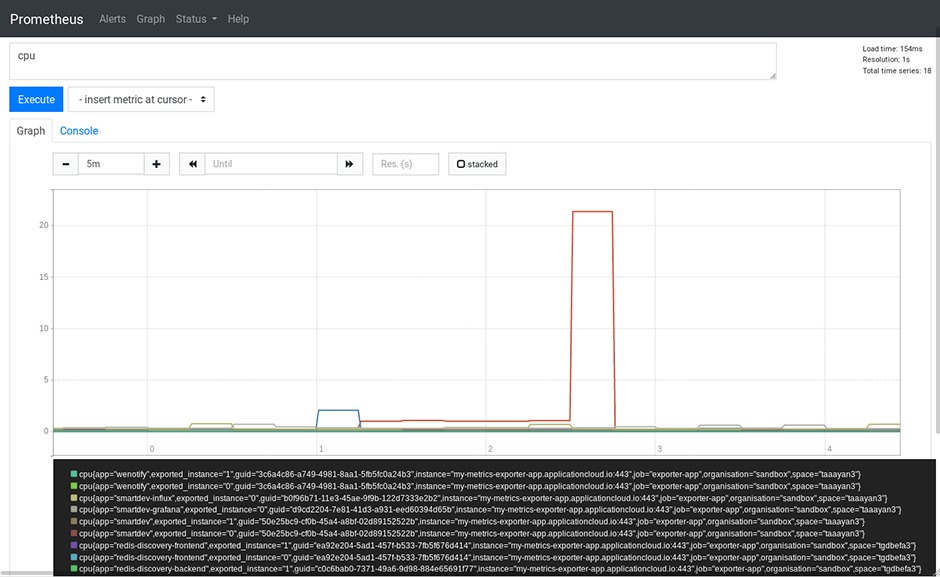
To verify if we are now really scraping metrics from our apps and get live data from Cloud Foundry we can query the CPU metrics in Prometheus:
Success!??
We now have a working Prometheus setup, with our Prometheus-Exporter app being responsible to collect and present application metrics via its /metrics endpoint to Prometheus.
At this point we could also start thinking about building some nice dashboards with Grafana, or some alerting with the Prometheus alert manager.
If you are a Swisscom internal AppCloud customer the recommended approach would be to use the CoMo platform (Continuous Monitoring, Wiki-Link(opens in new tab)) and get your managed Prometheus/Grafana from there.

Senior Cloud Engineer
Find the job or career to suit you. A career where you can make a difference and continue your personal development.
What you do is who we are.