Scientists (and binge-watchers) assemble! - getIT

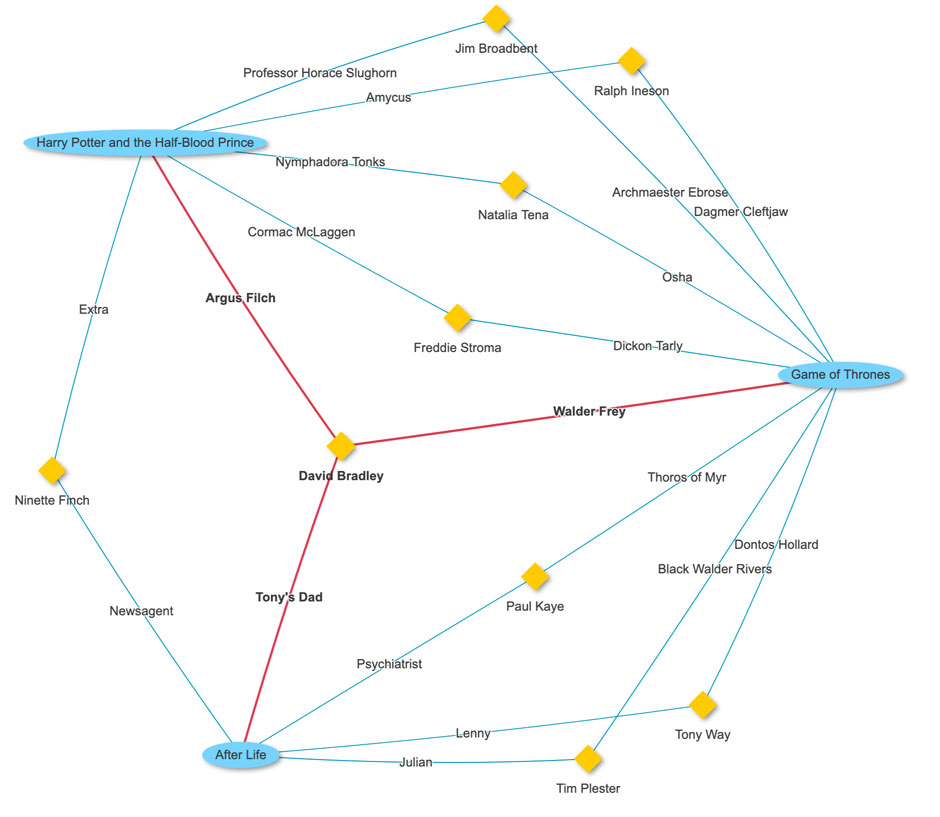
“Isn’t this the caretaker from the Harry Potter movies?” – “No, that’s Walder Frey from Game of Thrones.” – “Oh wait, now that I see it, David Bradley played both roles.”

That’s the conversation I recently had while watching After Life, a British comedy/drama TV series. 

To answer such questions, I wondered if there was some directory where I could enter the names of two TV series or movies. I would then expect to get a list of actors and actresses who play a role in both productions. A five-minute search didn’t immediately lead to any useful solutions, so I happily decided to implement it by myself. 

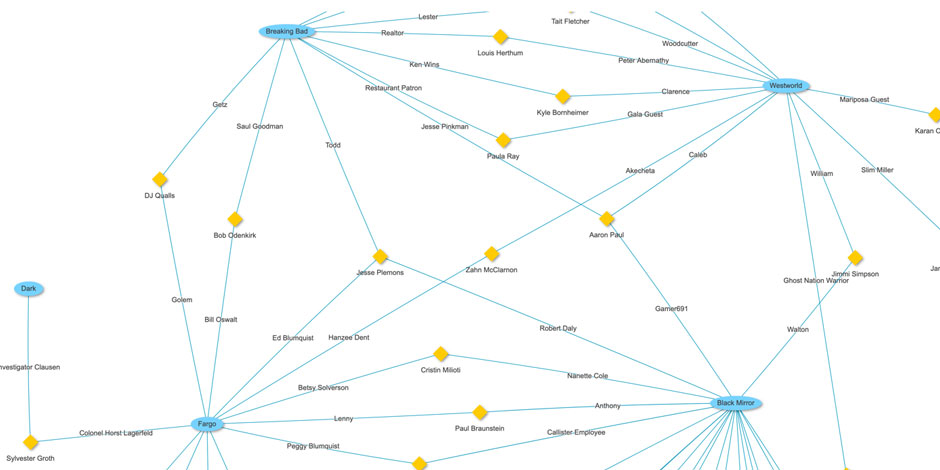
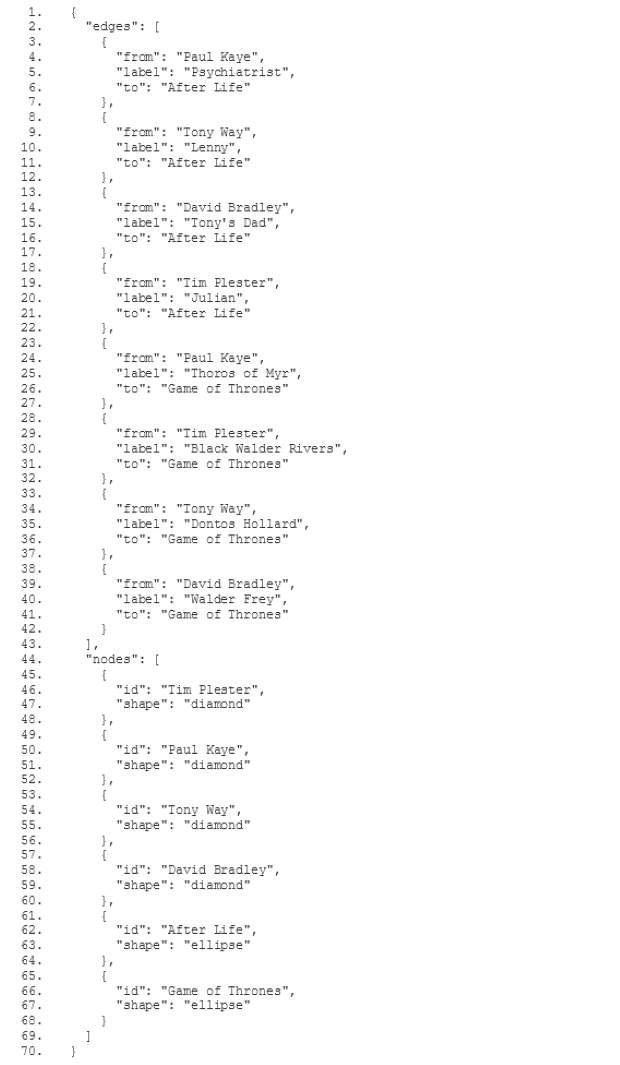
I had a graph in mind where actors/actresses are nodes and their respective roles edges connecting these nodes. 

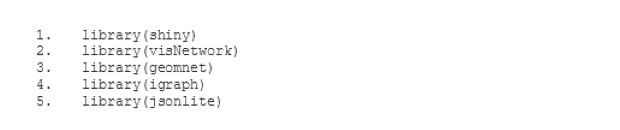
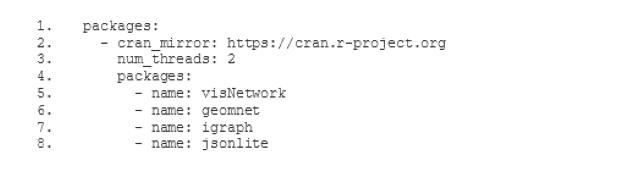
Luckily, the Swisscom Application Cloud ships with a built-in buildpack for the popular statistics language R. Thus, I only had to write an R-application to collect the necessary data and visualize it nicely as such a graph. 

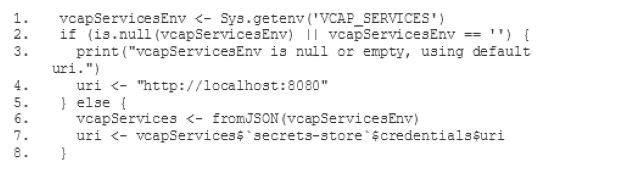
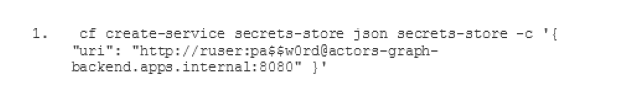
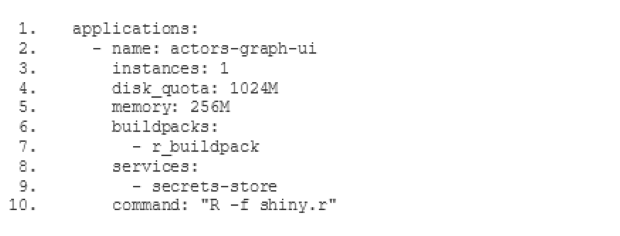
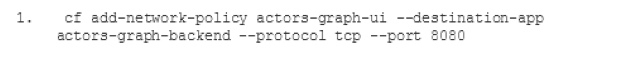
It turns out that I’m way more fluent in writing Java-apps than R scripts. So, I decided to write a small Java application based on the Reactive Spring framework, which does all the data crunching in the background and provides the results through an easy-to-consume interface. This way, I can also make use of the Application Cloud’s secret-store(opens in new tab) and Container Networking(opens in new tab).

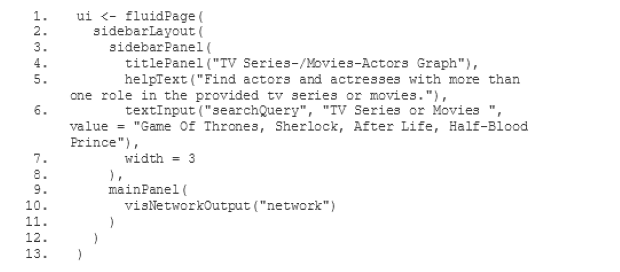
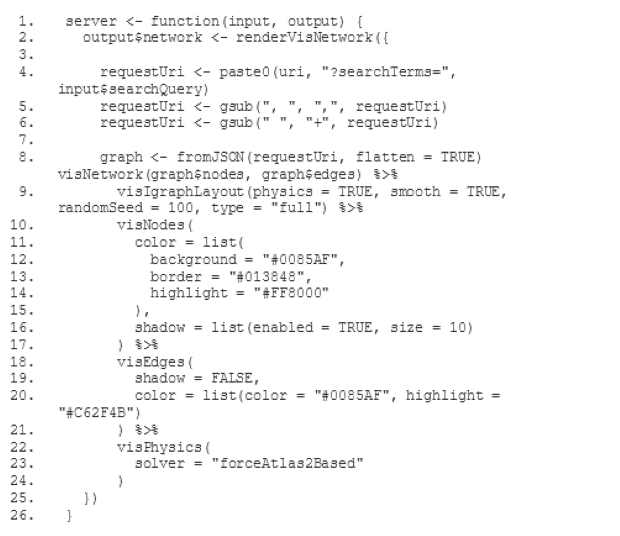
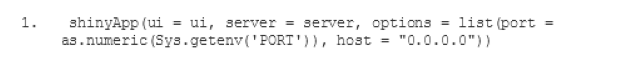
The frontend is written as a Shiny R app(opens in new tab). After learning about a couple of pitfalls and noteworthy configurations, I want to give you an idea on how to create a basic Shiny app using the R-Buildpack and deploy it to the Application Cloud. 

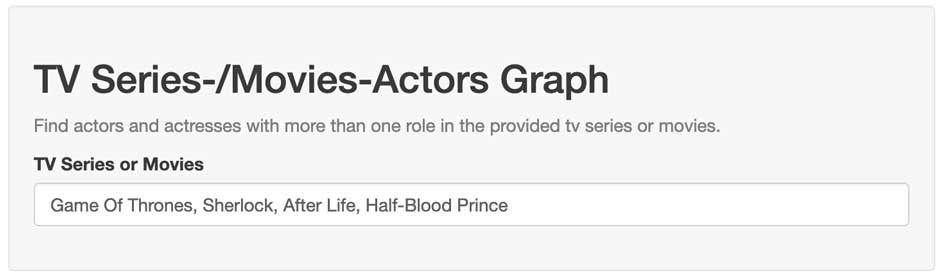
To start, assume users can enter a couple of TV series or movie names. The backend crawls a common movie database and returns a graph consisting of nodes and edges:

Now, to display this data, a Shiny app needs to consume and render it. 

I create a new R-script and start with adding these dependencies:

Afterwards, the UI is defined as follows:

searchQuery is the field of the user’s input with some titles as default values. In a browser, it looks like this:

The server logic is implemented to parse that input and fetch the results from a given URI. Afterwards, the graph is rendered with the help of visNetwork:

Note that I didn’t specify the backend’s host yet but expect a variable called URI to be set. 

I wouldn’t want to check-in my credentials in a VCS like Git, so I instruct the app to read the connection details from the environment with a default for local development:

This requires an instance of a secret-store(opens in new tab) to work. I’ve created one using this command:

Lastly, this command exposes the script as a runnable Shiny app:

Now, to deploy it, I have the following three files in the same directory:

- shiny.r (the app itself as depicted above)
- r.yml
- manifest.yml

The r.yml file contains the necessary dependencies and looks like this:

Note that this will install the dependencies. Don’t forget to use (with library(…)) them in the R script. Shiny is not being installed as it is shipped by default with the R buildpack. 

The manifest.yml is the well-known deployment manifest with this content:

Before pushing, remember to create a network-policy to allow the frontend to access the backend as configured in the secret-store’s URI:

Successfully deploying the app to the Application Cloud is as simple as a cf push. However, it might take quite some time until the staging process has downloaded all the R dependencies. There is an ongoing discussion on how to improve this in the future on Github. After the app is deployed, you access it through your browser and enter the productions you’re interested in. In the initial conversation, David Bradley wasn’t the only actor who was recognized to act in more than just one of the productions in question:

And that’s already it. I hope I could give you a short introduction to the R buildpack and you’re now able to deploy your Shiny apps as well. 

I want to thank all the contributors(opens in new tab) for their work on this buildpack. Consider it for your next scientific plots or to quickly draw other exciting data. 

Happy plotting!

Roman Bachmann

Roman Bachmann

Head of Cloud Platform Services

More getIT-articles

Ready for Swisscom

Find the job or career world that suits you. In which you want to help shape and develop yourself.

What you make of it is what defines us.

Go to careers

Go to current cyber security vacancies