Cloud

POWER BI Vs. SAP Analytics Cloud

In the Digital Age that we are living today, Data and Analytics inarguably play a significantly important role in the success of any Enterprise, small or big. The organizations, which know how to best use their Data residing at different locations to its fullest potential, are the most successful.

Moreover, the Evolution of cloud in the last decade has changed the definition of Analytics, previously Analytics was restricted primarily to Reporting and Dashboarding, but now Analytics has become much broader providing functionalities like Predictive Analytics, Machine Learning, Artificial Intelligence and so on. Therefore, we need Analytics Tools that should be able to provide basic as well as advanced functionalities to the customers, some of them would be:

  • Advanced Analytics functionalities like Predictive Analytics and Machine Learning
  • Self-service Analytics Capabilities to Business Analysts
  • Support for Hybrid Analytics scenarios for ex: data from cloud data sources or a combination of both cloud and on premise
  • Ability to connect to a broad range of Data Sources.

We have a lot of Analytics Tools / Platforms in the market, but in this Blog, we will look at the two most popular BI Tools in the market today – SAP Analytics Cloud and Microsoft Power BI. We will try to explore significant features in both the tools, compare the tools in terms of functionality for instance: Data Acquisition, Visualization, in order to find out which tool is best suited for which situation. As we discover in this blog, both these tools have their own strengths and limitations. The goal of this blog is not to make any recommendations, rather compare both the tools against important BI criteria in order to provide the customers with the important information, so that they can decide on the best BI tools for their scenario.

SAP Analytics Cloud

SAP Analytics for Cloud is a Software as a service BI Solution for the cloud providing all the important BI functionalities like data Modeling, Reporting, visualizing, Planning, Predictive, Governance Risk and Compliance and Self Service Analytic capabilities all in one unified product as compared to isolated BI products for Reporting, planning or Predictive. SAP Analytics Cloud is built on the powerful HANA Cloud Platform , which makes it flexible, Extensible, possibility of integration with third party Applications and provides access to different cloud and on premise Data sources and Applications in a modern and engaging User Interface.

Power BI

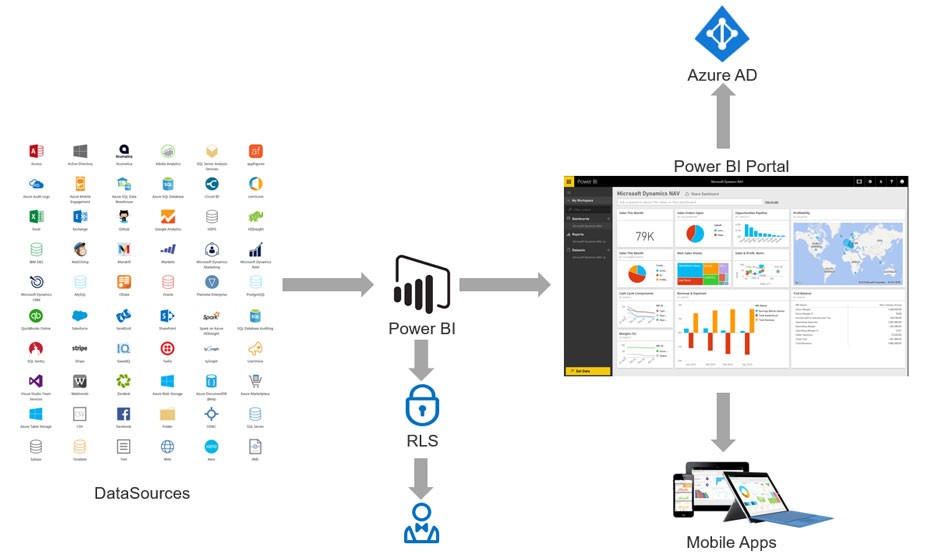
Power BI is an Analytics Tool by Microsoft that can connect to various Data Sources for creating Interactive Visualizations, Reports and Dashboards. Gartner has recognized Microsoft BI as a leader in Business Intelligence and Analytics Platforms. In contrary to SAP Analytics Cloud, Power BI is available both as an On-premise and a cloud based BI Tool. Power BI consists of three main components that work together:

  • Power BI Desktop - Windows based Application called Power BI Desktop used for connecting to Data Sources and creating Reports.
  • Power BI Service - A cloud, based software-as-a-service application, where you can view and share the Power BI Reports.
  • Power BI for Mobile.

Key Features – SAP Analytics Cloud

As mentioned previously, SAP Analytics Cloud provides a range of Analytics functionalities apart from Reporting and Dashboarding, which include for instance:

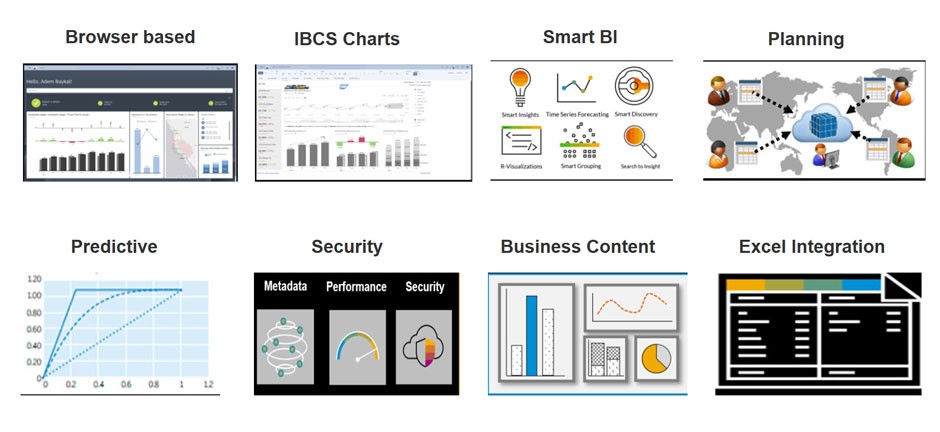
  • Business planning, which allows the controlling users to work with different versions of planning data like: Plan, Budget and Forecast data, comparable to traditional SAP Planning Applications like SAP BI Integrated Planning or SAP BPC.
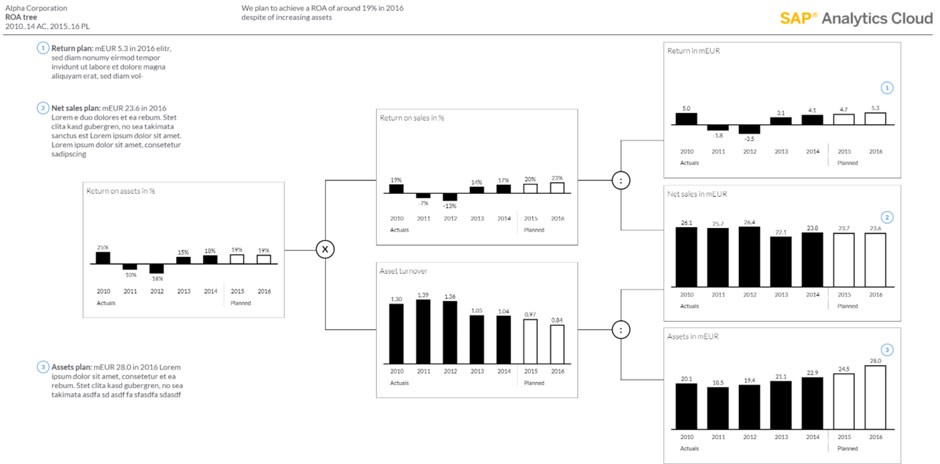
  • Embedded IBCS functionality for creating Visualizations adhering to the IBCS Principles.
  • Industry specific BI Content that can be installed and used.
  • Advanced Analytics features like Smart Predict, Smart Insights, and Smart Discovery that allows the Business User to analyze, explore and make forecasts without the need of any Programming code.

Key Features – Power BI

Power BI also provides a range of analytics functionalities to the Business users that include:

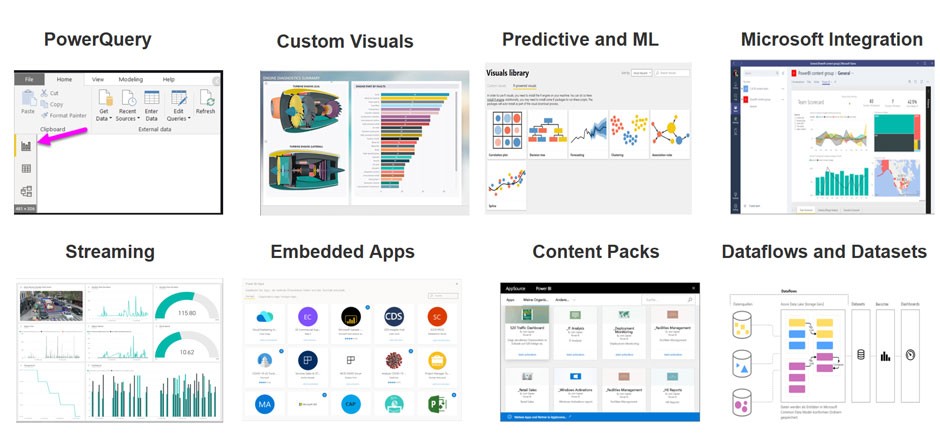
  • Power Query, a very powerful tool for Modeling and transforming the data before making it available for Reporting.
  • Power BI provides excellent Integration with a range of SQL as well as no SQL Databases, ERP Systems and other types of Source systems.
  • Excellent Integration with other Microsoft Products like Azure, SharePoint, Microsoft Teams.
  • Power BI also provides Dataflow, which can be used to create a complete ETL Pipeline without much effort.
  • Support for both Python and R for predictive Analytics scenarios.

Data Connectivity and Integration

It is a prerequisite today, that a BI Tool should be able to connect to numerous data sources irrespective of where the data is located, whether in cloud, on premise or even local. Customers also expect to perform data modeling, wrangling and other transformations without much effort. Here we will compare both the tools in terms of Data connectivity and Integration.

SAP Analytics Cloud

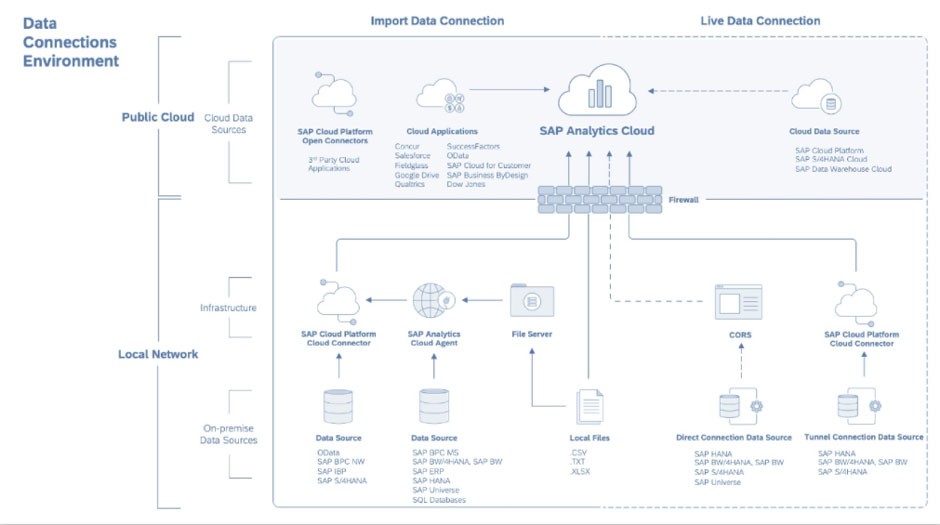
SAP Analytics cloud provides the possibility to connect to a variety of SAP and non-sap Data sources. We have two possibilities to connect to the Data in SAP Analytics Cloud, Live and Import connections.The Live connection makes it possible to connect to the underlying Data Sources virtually, without actually acquiring the data into the cloud, there by reflecting the changes in the source data in real time.

Currently the live connection is limited to SAP Systems such as:

  • SAP HANA
  • S/4 HANA
  • SAP Business Objects Universe
  • SAP BW
  • SAP BPC
  • SAP Data warehouse Cloud

The Live connectivity is an ideal option for existing SAP customers, who have most of their business data residing in SAP Systems like BW or HANA, to leverage their existing data models and using Analytics Cloud for creating reports and Dashboards. Live connectivity also enables using SAML SSO for existing SAP customers, which makes it possible to use one user logon for all SAP Systems.

The other connection type is the import connection, which means that data would be imported into the cloud, this is the preferred connection type, when the customers want to perform extensive data modeling activities in Analytics cloud, as well as some of the advanced features such as Smart Discovery on the data. Please note that not all the advanced features in Analytics Cloud can be used along with live connection data. Also in scenarios, where customers want to connect to non-sap systems such as MS SQL or other ERP systems, Import connection is the option.

Power BI

Power BI provides more than 100 Data connectors to be able to connect a range of Data Sources including SAP systems. The list of Data Sources supported in Power BI is exhaustive and keeps changing including on premise systems, cloud platforms like Azure, Online services and many more. The Query editor in Power BI that is Power Query helps the user to enhance and transform the data in a flexible, easy manner and if required also using M Language to perform advanced data transformations. Similar to SAP Analytics Cloud, Power BI also provides the possibility to either import the Data or virtually connect to the data with Import and Direct Query connections.

Interestingly, Power BI Direct Query also provides support for SAP Systems like HANA and SAP Business Warehouse. Just like its counterpart, Direct Query has some limitations when it comes to Data modeling and Transformation in Power Query Editor. The Import connection here also moves the data physically into Power BI, where all the Power Query functions can be used. The Data Modeling capability in Power BI with Power Query, compared to data modeling in Analytics Cloud is much more extensive and advanced. In order to connect to on premise systems, an additional component known as Power BI Gateway must be installed and configured.

Reporting, Dashboarding and Visualization

Data Visualization is one of the core areas of Business Intelligence, as it allows the Business and Data Analysts to analyze, explore and extract key information from the data. In this section, we will compare both the tools in terms of reporting, Dashboarding and Visualization.

SAP Analytics Cloud

SAP Analytics cloud makes it possible to create reports as well as Dashboards in the same tool. Unlike Power BI there is not a big distinction between a Report or Dashboard, as both of them can be created using the same technique, based on Analytics Cloud Data model either live or import. However, there are some smart features in Analytics Cloud, which makes the reporting experience more engaging like search to insight, smart discovery, smart insights and IBCS visualizations. It is by default possible to create an IBCS conform Reports / Dashboards in Analytics Cloud without any additional tools.

In SAP Analytics cloud, there are two tools, one is the stories with focus on self-service analytics, where the business users can create their own dashboards and reports, and the other is the Application designer, which allows the IT developers to create complex dashboards, cockpits or planning applications with JavaScript. SAP Analytics cloud also offers many visualizations for reporting, but compared to Power BI, this is limited.

Power BI

In Power BI, it is possible to create Interactive Reports, Paginated / Pixel perfect reports and Dashboards. Reports can be created both in Power BI Desktop as well the cloud based Power BI Service, reports usually comprise multiple pages of data providing detailed information with graphs, tables, filters and other elements , whereas typically a Dashboard summarizes the data at an aggregated level for the Management. Dashboards can created on the fly based on one or more reports in Power BI Service, whereas Reports can be created based on Power BI Datasets.

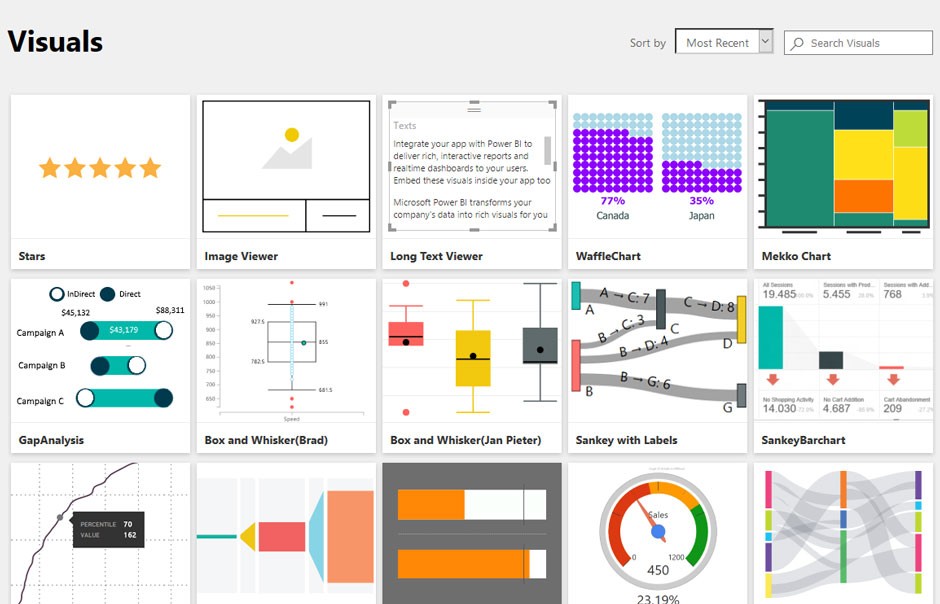
In addition to standard reporting, Power BI also offers the possibility of creating Paginated / pixel perfect formatted reports, similar to SAP Crystal reports. In order to create paginated reports, we need Power BI report builder and then these reports can be published to a wider audience in Power BI Service. Power BI provides an extensive list of visualizations for reporting, including some free as well as paid third party visualizations. Power BI offers a range of visualizations like basic charts, Maps, advanced visuals like decision trees, R-script visuals and many third party visualizations, where some of these are free and some paid. One of the biggest advantages in Power BI is DAX, a powerful analysis language that you can use to perform complex calculations on the fly in reports.

Advanced Analytics – Power BI und SAP Analytics Cloud

Both the tools offer numerous advanced analytics functions like Predictive Analytics, Machine Learning, AI, and Planning. SAP Analytics Cloud offers many advanced features with more focus on business users, like:

  • Search to insight, which performs a natural language search on the content in your Analytics Cloud platform.
  • Smart Discovery, which runs many machine-learning algorithms in the background, in order to determine key business influencers and make a forecast of your data.
  • Smart Predict to create your own predictive models from scratch without any coding.

Power BI on the other hand offers many interesting features, some of them would be:

  • Quick insights, which helps the user to find interesting insights with in the underlying data.
  • Support for both R and Python programming in Power Query for predictive use cases.
  • Possibility to connect to Azure Machine Learning models and other Azure services for visualizing the data.
  • Support to connecting to Real time streaming data sources like sensor data.

Pricing and Licenses

So far, we have the discussed the features and now we look at the pricing of both the tools.

SAP Analytics cloud offers two types of licenses:

Die Lizenz wird pro Benutzer gelöst. SAP Analytics Cloud bietet zwei Lizenz arten:

BI License – This includes all the key functionalities including the Advanced Analytics, which we have discussed previously, the cost is 22 CHF per User / per month and does not include the full planning functionalities.

Planning License – This includes the full range of planning functions and the BI part, the cost is around 147 CHF per User / per month. The cost for SAC planning license is quite high, when compared to the BI license and therefore is customer dependent.

Power BI also offers Power BI Pro License, which costs around 9.99 USD per user / per month, the premium license per user is around 20 USD every month and Power BI premium per capacity is

4,995 USD Per month. The Capacity license is an offering, where you can license multiple users, without having to purchase individual user licenses. In addition, there is also an Om-Premise Power BI report Server Option and the Power BI Embedded Licensing.
Summary

After we have compared both the tools against different BI criteria, we can say that each tool hast its own advantages and limitations. There is not perfect answer to what is the best BI tool for an Enterprise, because the answer is dependent on many factors like:

How is the current customer BI Architecture? What are the user expectations in terms of Self-Service Analytics?What are the different source systems?Does the current BI Tool fulfill all the requirements?How complex in terms of training and usage would be the new BI Tool for the Business Users?

SAP Analytics Cloud would be the perfect fit for existing SAP customers, who already have multiple SAP Systems in place like S4HANA, SAP BW, SAP BPC and son, because SAC has strong and seamless integration with these products, more focus on self-service and IBCS visualization as some of the advantages. It is a no brainer, that Power BI is best suited for existing Azure as well as MS SQL Customers; it is also the better tool, when the customer has more NON-SAP Systems in place.

Ravikiran Sattineni

Ravikiran Sattineni

Senior Data and Analytics Consultant

More getIT-articles

Ready  for  Swisscom

Find the job or career to suit you. A career where you can make a difference and continue your personal development.

What you do is who we are.

Go to careers

Go to current cyber security vacancies